Debugging Kotlin in the browser
| 最近更新 | 2020-02-23 |
Starting with Kotlin 1.3.60, the Kotlin/JS Gradle plugin automatically generates source maps for our builds. These enable support for debugging our code using browser development tools. To get started debugging our code, execute the run task in a project using the JS Gradle plugin, or browserDevelopmentRun in a multiplatform project. Once the development server is running, we can start our debugging session from the browser.
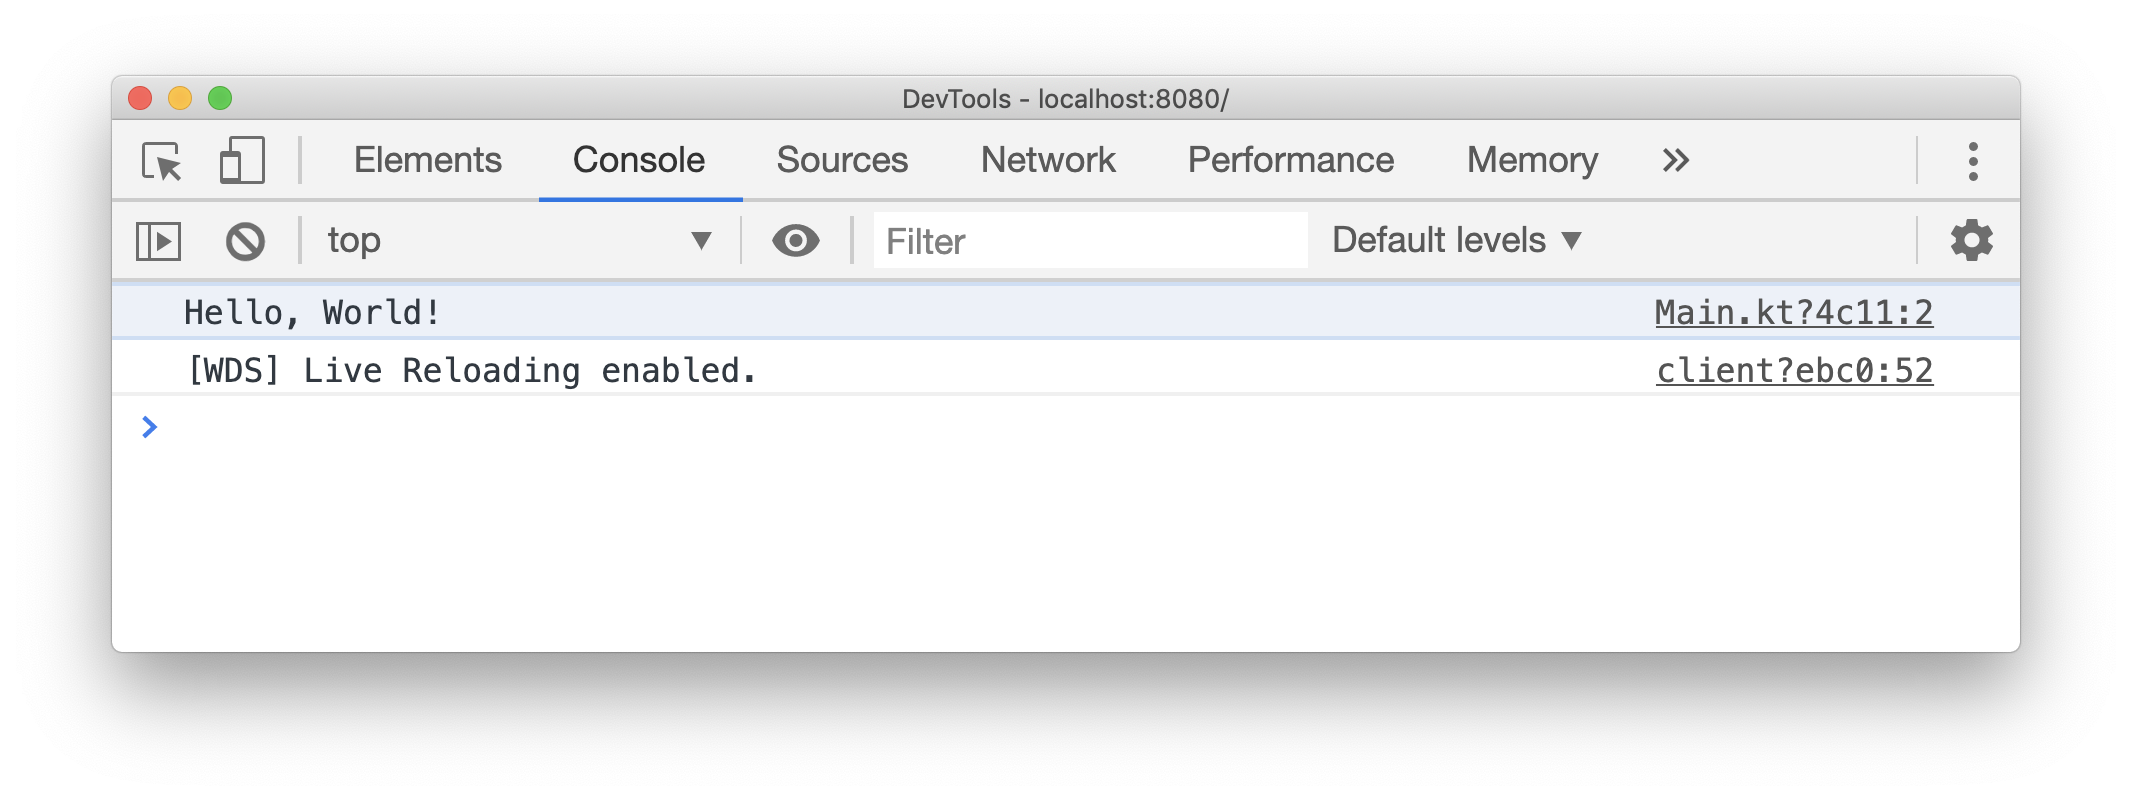
To begin debugging, let's navigate to the page and launch the developer tools of our browser (for example by right-clicking and selecting the Inspect action). If our program is logging information to the console, we can navigate to the Console tab to see this output. Depending on our browser and its developer tools, these logs will also reference the Kotlin source files they originate from:

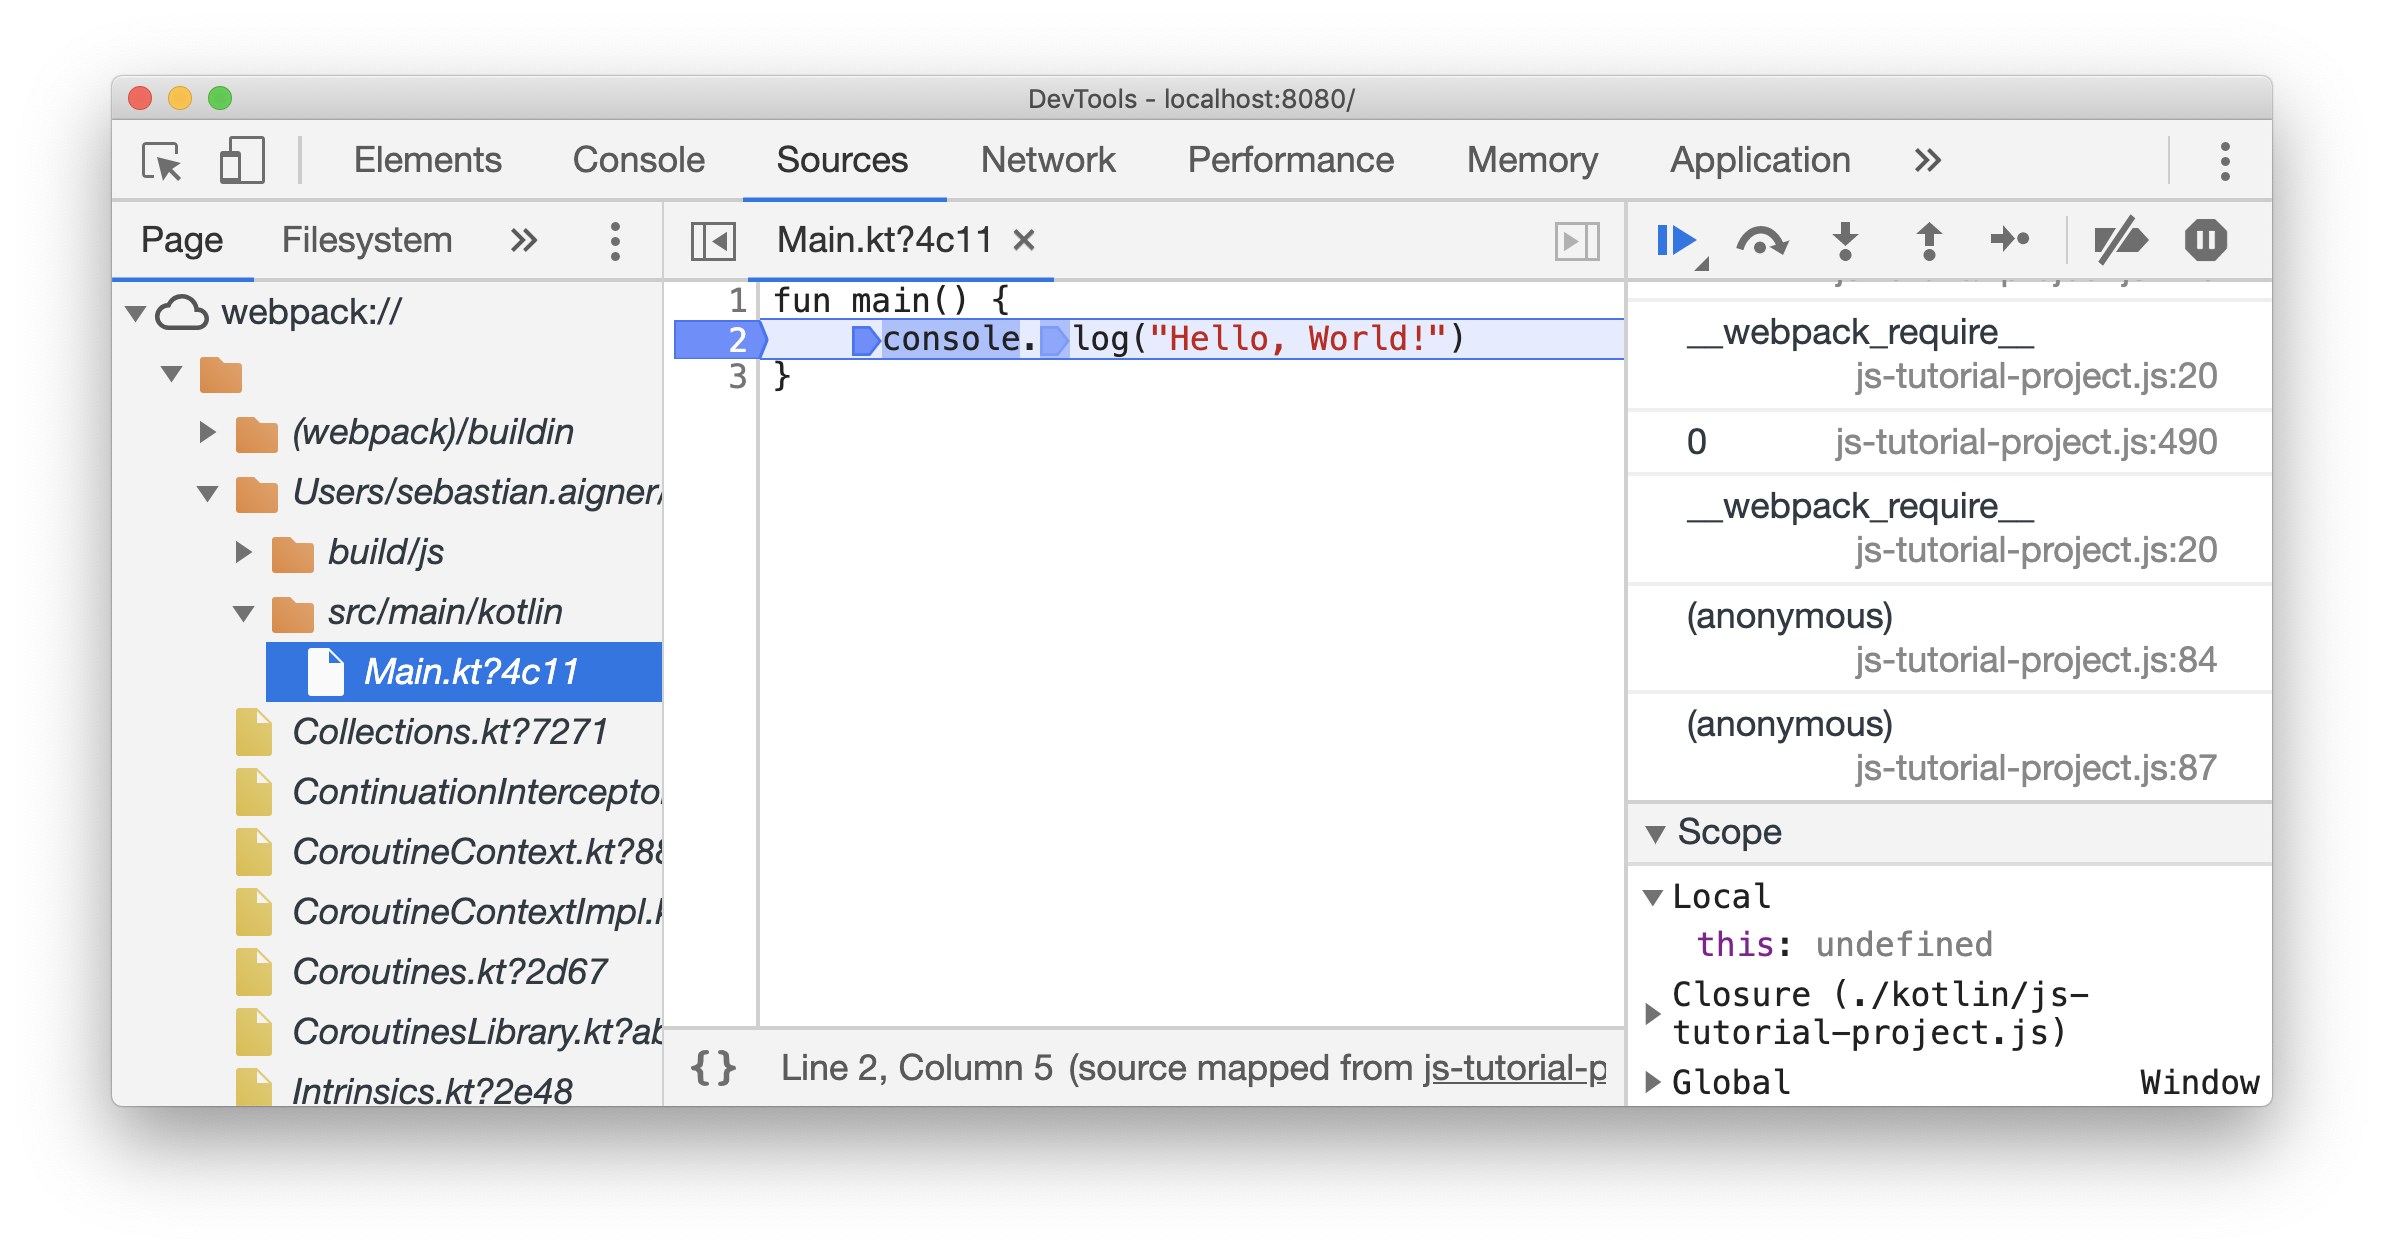
We can click the file reference on the right to navigate directly to the corresponding statement. Alternatively, we can manually switch to the Sources tab, and find the correct file in the file tree. Navigating to the Kotlin file actually shows us regular Kotlin code (as opposed to minified JavaScript):

We can now start debugging our program. For example, we can set a breakpoint by clicking on one of the line numbers. The developer tools even support setting breakpoints within a statement. As with regular JavaScript code, any set breakpoints will persist across page reloads. This also makes it possible to debug Kotlin's main method which is executed when the script is first loaded.